The arithmetic of attrition: the cost asymmetry of the U.S.–Israel–Iran missile war and why it is unsustainable for the United States
Abstract. Across 2024–2026, Iran and the Israel–United States coalition fought the first sustained ballistic-missile-versus-interceptor war in history. Tactically it was a defensive success: the great majority of Iranian missiles and drones were intercepted [4][6][8]. Economically it was a defeat for the defender, and a structural one. In missile defence the cost curve is inverted — the cheap thing flies and the expensive thing catches it — so the defender spends roughly 3–10× the attacker per salvo and 10–100× per individual engagement [1][2][9]. This paper quantifies that asymmetry using the parametric cost model behind this site’s war-cost-sim, cross-checks it against open-source reporting, and argues that the binding constraint is not dollars but interceptor magazine depth: the United States expended on the order of a quarter of its THAAD stock and several years of SM-3 output in a matter of weeks [3][4][7]. Because the U.S. is the global interceptor reserve for every theatre at once, this attrition is uniquely unsustainable for it. The disease is the cost-exchange ratio; the cures all attack that ratio rather than the hit rate.
1. Introduction: the inverted cost curve
For most of military history, attacking a defended position cost more than holding it. Walls, entrenchments, and armour favoured the defender. Precision air defence quietly inverted that logic. A modern interceptor is an exquisite object — a guided rocket with a seeker, a kill vehicle, and a multi-year supply chain — while the things it kills have become cheap and numerous. An attack drone now costs the price of a used car; the missile that reliably kills it can cost the price of a suburban street.
This is not a marginal inefficiency. It is the organising principle of the adversary’s strategy. RAND frames the contemporary problem as “quantity has a quality all of its own”: the attacker need not destroy the defence in any single raid, only force it to expend irreplaceable interceptors faster than industry can rebuild them [1]. The U.S. Army’s Modern War Institute calls this the “cost-exchange logic” of air defence and treats it as the defining operational problem of the decade [2].
The U.S.–Israel–Iran war is the largest live test of that logic to date. The sections below establish the asymmetry at three scales — per weapon (§2), per salvo (§3), and per campaign against finite magazines (§4–5) — then turn to why the burden lands on the United States specifically (§6), how the competing doctrines drive the outcome (§7), and what could change it (§8).
Note on the model and the figures. Every figure in this paper is generated by porting the deterministic expected-value engine of the war-cost-sim (
computeExpected()) and running it on documented salvos; the script lives atsite/scripts/gen-war-cost-figures.mjs. Unit costs are open-source estimates [1][2][5][9][11][13]; salvo totals for 2024–2025 are documented [4][6][7][8][12], while the 2026 (“True Promise IV”) campaign figures are reconstructed from the project’s inventory and should be read as indicative. The argument is an order-of-magnitude one and survives a ±50% error on any single line.
2. The unit-cost asymmetry
Start with the weapons themselves. Figure 1 places Iranian munitions and coalition interceptors on a single logarithmic axis. The point is immediate: the entire defensive cluster sits 10–100× to the right of the threats it is built to kill.
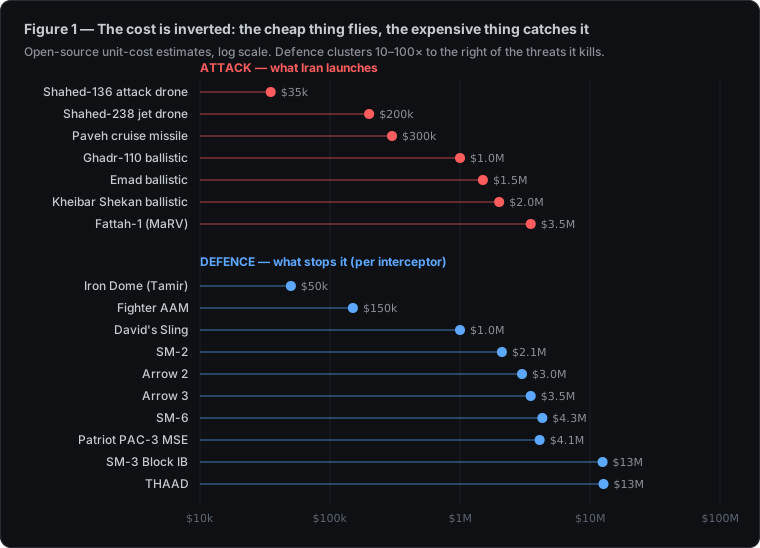
Two features of Figure 1 carry the whole argument.
The ballistic exchange is bad; the drone exchange is the trap. A $1–3M ballistic missile met by a $3–12.7M interceptor is already a losing trade. But the genuinely absurd exchange — and the deliberate one — is the drone. A Shahed-136 costs roughly $20k–$50k [9][11]; engaged by a Patriot PAC-3 MSE at about $4.1M, that is a 120:1 loss [2], and against a higher tier it can reach 300:1 [1][9]. The drone does not need to arrive. It needs to force an expensive shot.
Mixing is the weapon. Iran’s salvos deliberately interleave cheap drones and cruise missiles with ballistic missiles [4][6]. The drones and cruise missiles saturate the sensor picture and draw down the cheaper magazines; the ballistic missiles then arrive against a thinner, more expensive, partially depleted defence. The cost asymmetry is the munition; the warhead is secondary.
3. What each salvo actually costs
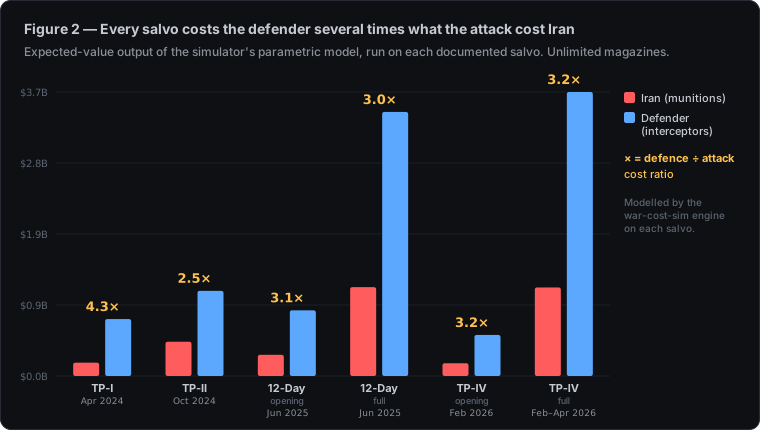
Aggregating unit costs over real salvos turns the asymmetry into a budget. Figure 2 runs the simulator’s model over six documented attacks, from the first-ever direct strike (True Promise I, April 2024) to the 2026 campaign, with unlimited magazines so the comparison is purely economic.
Three observations:
- The ratio is robust. It never drops below ~2.5× and reaches ~4.3× for the drone-heavy opening of the war [Figure 2]. The defender loses the budget contest every single time, regardless of how the salvo is composed.
- The absolute numbers are large but not the limiting factor. A heavy campaign night models to several billion dollars of interceptors. A state with an US$850B+ defence budget can, on paper, absorb that. The dollar figure is the symptom; §4 identifies the actual disease.
- The model is conservative. It assumes unlimited magazines and excludes the cost of forward-deploying Aegis destroyers, flying continuous fighter combat air patrol, and the ground damage from leakers — all of which fall on the defender’s side of the ledger.
For the June 2025 war specifically, open sources document the human-scale version of Figure 2: of at least 574 ballistic missiles launched, Israel attempted to engage 257 and judged 201 fully successful — an ~86% success rate among attempted interceptions [6][8] — while THAAD and Arrow together downed roughly 201 of the 574 [4]. High interception, achieved by spending several billion dollars of interceptors against a few hundred million dollars of missiles [5][12].
4. The binding constraint: magazine depth versus production
If the war were only about money, it would be affordable. It is not only about money. It is about how fast the specific, exquisite interceptors can be manufactured — and that rate is glacial next to how fast they are fired.
During the twelve days of June 2025 the United States alone expended, by open-source accounting, on the order of 150+ THAAD interceptors — roughly a quarter of the entire U.S. THAAD stockpile — and about 80 SM-3s [4][7]. CNN’s investigation put U.S. operational THAAD stocks below 500 afterward, against an annual production capped near 100 units (only 12 were built in 2025; 37 are planned for 2026) [7]. SM-3’s maximum sustainable production is about 24 per year [3]. Figure 3 sets expenditure against production.
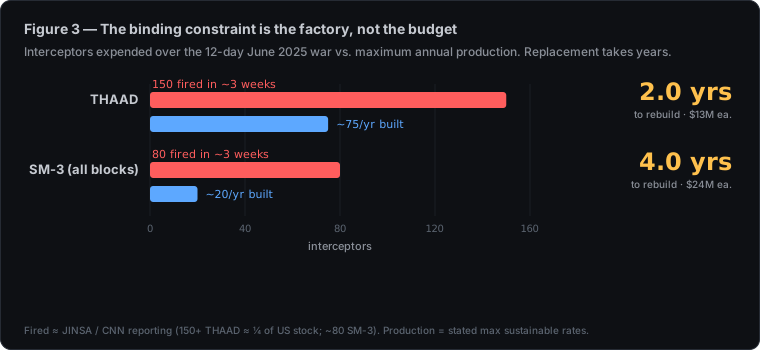
This is the operational meaning of “unsustainable.” It is not that the Treasury runs out of dollars; it is that the shelves run out of interceptors and the factory cannot refill them inside the timeframe of a war. The European Policy Centre’s post-war assessment is blunt: coalition interceptor consumption in the first 72 hours exceeded near-term production capacity for reconstitution [10]. Money appropriated today buys missiles that arrive in 2028–2030. The defender’s tempo is capped by its slowest production line; the attacker’s tempo is capped only by how many workshops it can stand up.
5. The magazine wall under saturation
The two preceding constraints compound. As a salvo grows, the defender is pushed to fire more of the expensive, scarce tiers — and once those magazines empty, additional interception simply cannot be bought at any price. Figure 4 runs the simulator with magazine limits on versus off across growing salvos.
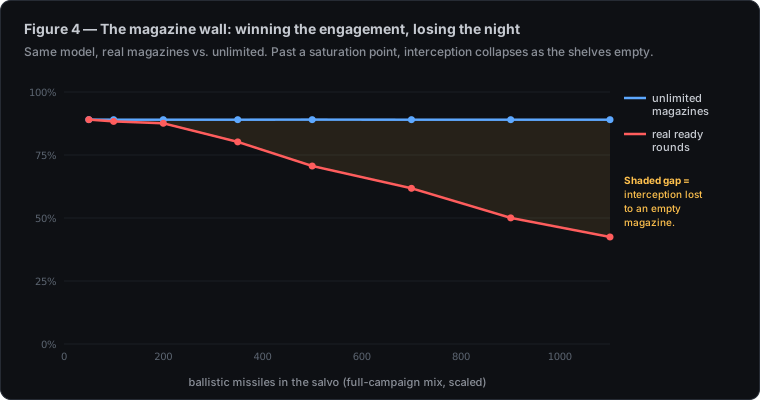
Two consequences follow. First, saturation makes each engagement more expensive at exactly the moment volume rises: you cannot meet a 500-missile raid with short-range rockets alone, so the average dollars-per-kill climbs as the cheap magazines exhaust and the fight moves up-tier. Second, the defender’s “win rate” is a function of magazine depth, not just technology — which is precisely the variable the attacker is attacking. A defence that intercepts 95% on a good night can intercept far less on the night after, with no change in the hardware, simply because the magazine is thinner. This matches the documented late-war pattern: interception rates declined as stocks drew down even though salvos shrank [4][6].
6. Economic (un)sustainability for the United States
Israel feels the cost acutely, but Israel is one front defending one country. The reason the war is strategically unaffordable is that the United States is the global magazine of last resort, and missile attrition treats that global reserve as if it were local. Four compounding mechanisms:
(a) Opportunity cost across theatres. THAAD and SM-3 are not Levant-specific assets. They are the same interceptors tasked with defending Guam, forward forces in the Western Pacific, Gulf bases, and elements of homeland defence. Every Talon fired over the eastern Mediterranean is one unavailable if a second crisis opens [3]. The cost is measured not in dollars but in deterrence credibility in the theatre Washington ranks highest — spending the Pacific reserve on the Levant is a trade an adversary is delighted to impose.
(b) A thin, slow industrial base. Three decades of underinvestment left the exquisite-interceptor base sole-sourced and capacity-constrained [3][10]. The U.S. can out-produce almost anyone in aggregate, but not in these specific items on a wartime clock. An adversary’s cheap-mass base scales in months; the high-end interceptor base scales in years (Figure 3).
(c) The cost-per-kill curve runs the wrong way under load. As §5 shows, saturation forces up-tiering, so the average cost per successful intercept rises with the volume of intercepts [Figure 4]. The attacker’s marginal cost per launch is roughly flat; the defender’s marginal cost per save climbs.
(d) Expensive, exposed enablers. Holding Aegis destroyers on ballistic-missile-defence station, flying continuous fighter combat air patrol, and running THAAD batteries forward is a continuous burn of the scarcest naval and air assets — platforms then unavailable for the missions they were built for, in the theatre that matters most.
The sustainability verdict is therefore asymmetric in a second sense. For Iran, whose theory of victory is attrition and cost-imposition, the war is sustainable: it spends a few hundred million dollars of disposable mass per heavy night [Figure 2] from a base that scales quickly, and it buys down the irreplaceable U.S. magazine at roughly ten cents on the dollar. For the United States, whose theory of victory is reassurance through interception, the war is not sustainable: it wins the engagements while expending a strategic reserve it cannot refill for years [3][7][10]. Both sides can be telling the truth when one says “we shot almost all of them down” and the other says “we are winning” — they are scoring different games.
7. Doctrinal differences
The outcome is not an accident of hardware; it is produced by three doctrines optimised for incompatible objectives.
Iran — cost-imposition and saturation. Iranian doctrine has converged on attrition: layered salvos that mix Shahed-136/238 drones, Paveh-class cruise missiles, and a ballistic spectrum from Ghadr to the manoeuvring Fattah, timed to saturate sensors and force magazine expenditure [4][6]. The doctrine does not require any single salvo to penetrate; it requires the cumulative trade to favour Iran. “Quantity has a quality all of its own” is, in effect, Iranian operational policy [1].
Israel — defend everything important. Israeli doctrine is dense, layered point-and-area defence — Iron Dome, David’s Sling, Arrow 2 and Arrow 3 — with a high political willingness to expend interceptors to protect population centres and key bases [6]. This maximises interception probability, which is exactly what makes it magazine-expensive: a doctrine of “defend everything important” meets the attacker’s cost-imposition doctrine on the attacker’s preferred terms.
United States — interceptors as strategic reserve and reassurance. U.S. doctrine treats THAAD and Aegis BMD as instruments of extended deterrence: forward-deployed to reassure allies and backstop their defences [3][4]. The tension is structural — a doctrine of reassurance by presence commits a finite, globally fungible magazine to a local, attritional fight. Standard “shoot-shoot” engagement practice (two interceptors per threat for confidence) doubles the magazine burn precisely where the magazine is scarcest.
The decisive point is that the defender’s own doctrine is the mechanism of its bleeding. Optimising for interception probability — up-tiering, shoot-shoot, defend-everything — is what converts a $35k threat into a multi-million-dollar response. The attacker’s doctrine is designed to exploit the defender’s doctrine, not its hardware. Any durable fix therefore has to change the defender’s doctrine, not merely its interceptors.
8. What changes the ratio
A defence that wins on the radar can still lose on the spreadsheet, and a defence that loses on the spreadsheet eventually loses on the radar too — an empty magazine intercepts nothing (§5). The cures all attack the ratio, not the hit rate:
- Cost-per-kill defences. Directed energy (Israel’s Iron Beam high-energy laser entered service in 2025) and gun-based close-in systems change the marginal economics from millions-per-shot to dollars-or-thousands-per-shot against drones and cruise missiles [2][9]. Their limits are real — power, cooling, weather, range, single-target engagement rates — but every drone a laser kills for the price of its electricity is a million-dollar interceptor preserved for the ballistic threats that genuinely require it.
- Tiering discipline. Do not meet a $35k drone with a $12.7M interceptor. The attacker’s entire game is forcing the defender up-tier; the counter is ruthless allocation so cheap threats are met by cheap layers and the exquisite interceptors are reserved for ballistic missiles only [2].
- Engagement discipline — accept leakers. Doctrinally permitting cheap, low-consequence threats to fall in open ground, and shifting from “shoot-shoot” toward “shoot-look-shoot,” conserves the magazine for what matters. This is a political decision as much as a military one.
- Left-of-launch. The cheapest interceptor is the one never fired. Striking launchers, drone-assembly sites, and the adversary’s production base attacks the attacker’s cost side instead of inflating the defender’s [1][2].
- Magazine depth as a peacetime program. Treat interceptor inventory and production rate as a first-order readiness metric, funded and surged in peacetime — because, as Figure 3 shows, it cannot be surged in war [3][10].
9. Conclusion
The U.S.–Israel–Iran missile war is the clearest demonstration yet that tactical and economic victory have decoupled in air defence. The coalition shot down most of what was fired at it [4][6][8] and, in doing so, spent several times the attacker’s outlay per salvo [Figure 2] and a quarter of its THAAD magazine in three weeks [4][7]. Against an adversary whose explicit theory of victory is to make the defender expend an irreplaceable magazine on disposable mass, “we intercepted almost all of them” is a description of a defender being bled at a discount, not a strategy. The uncomfortable conclusion for the United States is that it can be on the winning side of every engagement and the losing side of the war — and the only way off that curve is to change the cost-exchange ratio and the doctrine that produces it, not to admire the interception rate.
Methods and interactive model
The figures above are the deterministic expected-value output of the same parametric engine that drives the simulator below: per threat category, an ordered chain of defence layers each defined by an engageable share (cov), interceptors per engagement (salvo), single-shot kill probability (Pk), and dollars-per-shot, with optional magazine caps set to publicly reported ready-round counts. The figure generator (site/scripts/gen-war-cost-figures.mjs) imports those exact tables. You can change any cost, probability, magazine, or salvo below and watch the exchange ratio move in real time.
Data provenance: a weighted multi-source store
The cost figures in this paper are not single numbers plucked from one report — the open sources disagree, sometimes by an order of magnitude (a Shahed-136 is quoted anywhere from a $4k component-cost headline to a ~$193k full-supply-chain estimate; an SM-3 Block IIA from ~$28M to ~$45M). To handle that honestly, the repository carries a small versioned data store (war-cost-data/) that records every source observation with its provenance and date, and a combiner (war-cost-data/combine.mjs) that reconciles them.
The combiner runs an ensemble of estimator “agents” — a source-reliability-and-recency-weighted mean, a robust weighted median (the published consensus, because it resists outliers), a trimmed mean, and a primary-sources-only mean — and reports a consensus value, an uncertainty band, and a confidence score derived from how far the agents disagree. An optional second layer can call a Claude model (--llm, defaulting to the cheapest capable model) to adjudicate the most contested items and attach an advisory verdict; it never overrides the deterministic consensus and is skipped entirely when no API key is present. Figure 5 is generated directly from that store’s output.
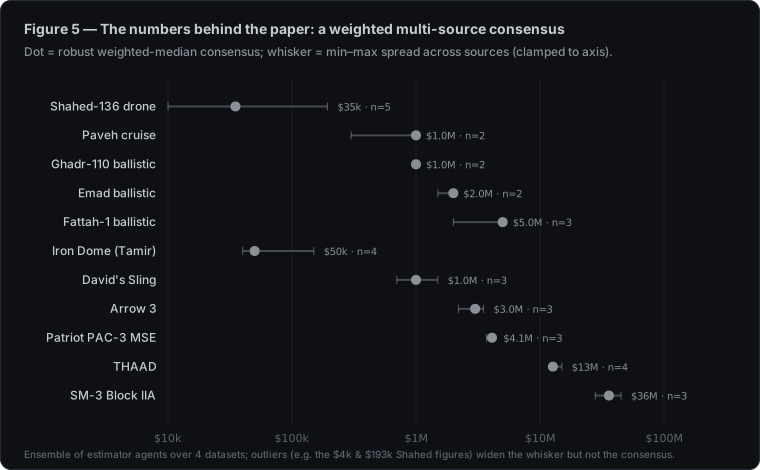
n = number of sources. Outliers (the $4k and $193k Shahed-136 figures, the $45M SM-3 IIA) widen the whisker but do not move the consensus — which is the point of using a robust median. Source: war-cost-data/ store and combiner.The model loads satellite imagery and elevation tiles from public endpoints and renders in WebGL; if the embed does not load, open it full-screen. All munition and interceptor costs are editable open-source estimates; the model is educational, not predictive.
References
- RAND Corporation, “David vs. Goliath: Cost Asymmetry in Warfare,” March 2025. rand.org
- Modern War Institute at West Point, “The Indispensable Interceptor: Air Defense and the Problem of Cost-Exchange Logic.” mwi.westpoint.edu
- Center for Strategic and International Studies (CSIS), “The Depleting Missile Defense Interceptor Inventory.” csis.org
- JINSA Gemunder Center for Defense and Strategy, “Shielded by Fire: Middle East Air Defense During the June 2025 Israel–Iran War,” August 2025. jinsa.org
- JINSA, “Missile and Interceptor Cost Estimates During the U.S.–Israel–Iran War,” 21 July 2025 (PDF). jinsa.org
- Foreign Policy Research Institute (FPRI), “Shallow Ramparts: Air and Missile Defenses in the June 2025 Israel–Iran War,” October 2025. fpri.org
- CNN, “US used about 25% of its THAAD missile interceptors during Israel–Iran war,” 28 July 2025. cnn.com
- Foundation for Defense of Democracies (FDD), “Israeli Assessment of Recent Conflict With Iran Reveals 86 Percent Success Rate in Missile Interception,” 2 July 2025. fdd.org
- The Globe and Mail, “The high price of intercepting Iran’s low-cost drones.” theglobeandmail.com
- European Policy Centre, “The new economics of warfare.” epc.eu
- Esfandyar Batmanghelidj, “Drones Like Bicycles,” Phenomenal World. phenomenalworld.org
- Al Jazeera Centre for Studies, “Twelve Days of Inferno: The Cost of Opening Pandora’s Box.” studies.aljazeera.net
- CSIS Missile Defense Project, “Missile Threat” system profiles (THAAD, SM-3, Arrow, Iron Dome). missilethreat.csis.org
- Project source notes, parametric cost model, and reconciled data store —
war-cost-simandwar-cost-data/(this repository): the inventory and order-of-battle inwar-cost-sim/STATE.md, and every source observation with its weighting inwar-cost-data/(seeconsensus.mdfor the combined table).
Data note: figures for the 2024–2025 events are documented in the cited reporting; the 2026 (“True Promise IV”) campaign figures are reconstructed from the project inventory and are indicative rather than authoritative. Unit costs are open-source estimates and carry wide error bars; the paper’s conclusions rest on order-of-magnitude asymmetries, not precise accounting.